Common Metrics
| Name | Explanation | Key Params | Usage | Example |
|---|---|---|---|---|
| ROC Curve1 | Receiver operating characteristic curve: A graph showing the performance of aclassification model at all classification threshhold. | y: True Positive Ratex: False Positive Rate | ROC curve is used to indicate the |  |
| AUC Curve2 | Area under the ROC curve: One way of interpreting AUC is as the probability that the model ranks a random positive example more highly than a random negative example.when randomly choose one sample, the probability that the score of predicted true label comes before false label. |  AUC represents the probability that a random positive (green) example is positioned to the right of a random negative (red) example.1 AUC represents the probability that a random positive (green) example is positioned to the right of a random negative (red) example.1 |
 |
|
| TPR | True positive rate, synonym for recall, actual positive data is classified as positive. | $\frac{TP}{TP+FN}$ | ||
| FPR | False positive rate, negative data is classified as positive. | $\frac{FP}{FP+TN}$ |
Concepts
Prediction and Recall
This is very well introduced in this article: Precision and recall.
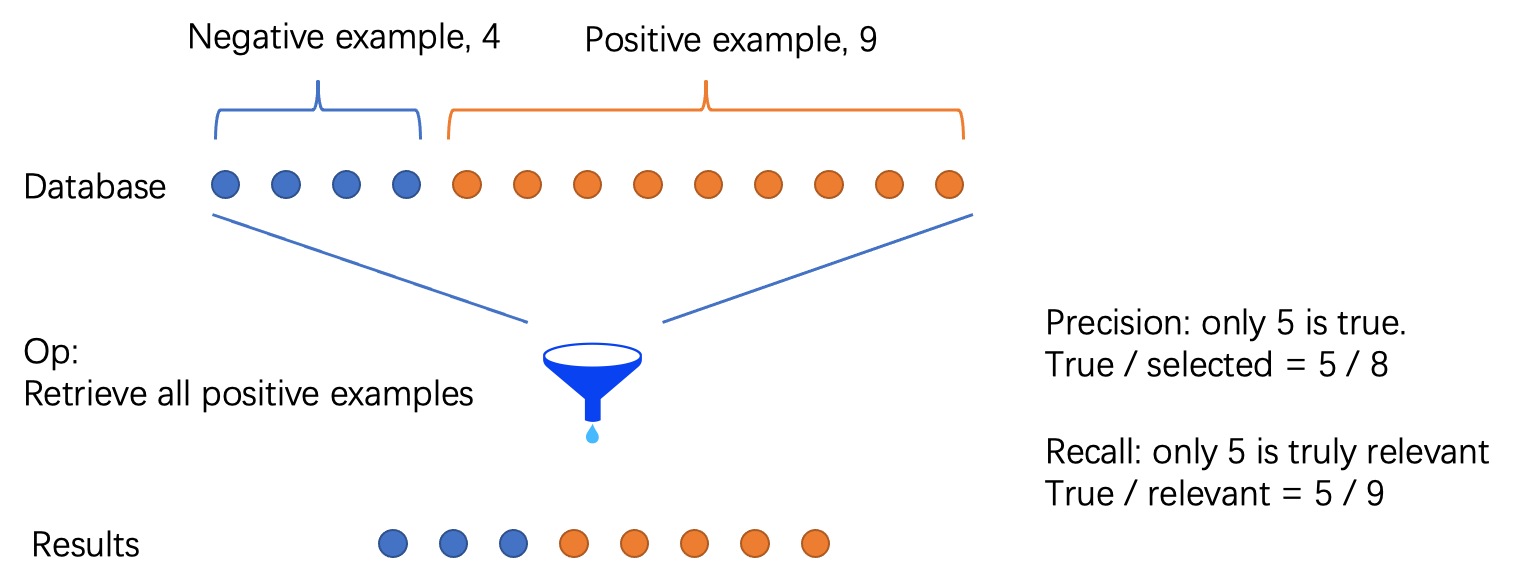
In pattern recognition, information retrieval and classification (machine learning) “Classification (machine learning)”), precision and recall are performance metrics that apply to data retrieved from a collection, corpus or sample space.

The difference between precision and recall is that precision measures how accurate of a certain retrieval, which differs a lot when retrieving multiple times from database. On the other hand, recall measures how complete of a certain retrieval.
上篇AI算法